Spatial Frequency Response (SFR) Curve Graphs
Descriptive Information
Permalink
https://exhibits.library.illinois.edu/s/illinois-digitization/item/4624
- Title
- Spatial Frequency Response (SFR) Curve Graphs
- Description
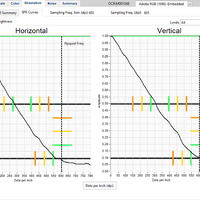
- Lightness Tab selected, the graph shows horizontal and vertical gray slant lines measured favorably, reaching past 250 dots per inch (dpi) resolving at 50% amplitude and past 550dpi at 10%, toward the highest effective resolution Nyquist Frequency aim for an image captured at 605dpi.