Tonescale Graph from Scanner with dark scans
Descriptive Information
Permalink
https://exhibits.library.illinois.edu/s/illinois-digitization/item/4632
- Title
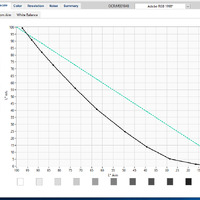
- Tonescale Graph from Scanner with dark scans
- Description
- Here's an example from the testing results from our software. You can see where a neutral reproduction would be (the dotted line) and the curved line is the rendering that the settings on the scanner are producing. The dip represents the darkness we're seeing.